Performance
Overview
A poorly written application will always have poor performance. A very common way for developers to increase the performance of their application is:
Solution?
just throw more hardware to it
The problem with the above approach is two fold. For starters, in most cases the owner is the one that will incur the additional costs. The second issue is that there comes a time that one can no longer upgrade the hardware and will have to resort to load balancers, docker swarms etc. which will skyrocket costs.
The problem will remain: the poorly written application
In order to speed up your application, you first need to ensure that your application is written with the best way possible that fulfills its requirements. Nothing beats a good design. After that, there are many aspects to consider: - server hardware - clients connecting (location, browsers) - network latency - database hardware
and many more. In this article we will try to highlight some scenarios that could provide more insight as to where your application is really slow.
NOTE
These are recommendations and good practices. You are by no means obligated to follow the advice on this document, and by no means is this list exhaustive. Your performance enhancing strategies rely primarily on the needs of your application.
Server
Profiling is a form of dynamic application analysis that offers metrics regarding your application. Profiling offers the real picture on what is really going on at any given time in your application, and thus guide you to areas where you application needs attention. Profiling should be continuous in a production application.
It does have an overhead so that has to be taken into account. The most verbose profiling happens on every request but it will all depend on your traffic. We certainly do not want to increase the load on the server just because we are profiling the application. A common way of profiling is one request per 100 or one per 1,000. After a while you will have enough data to draw conclusions as to where slowdowns occur, why peaks occurred etc.
XDebug
XDebug offers a very handy profiler right out of the box. All you have to do is install the extension and enable profiling in your php.ini:
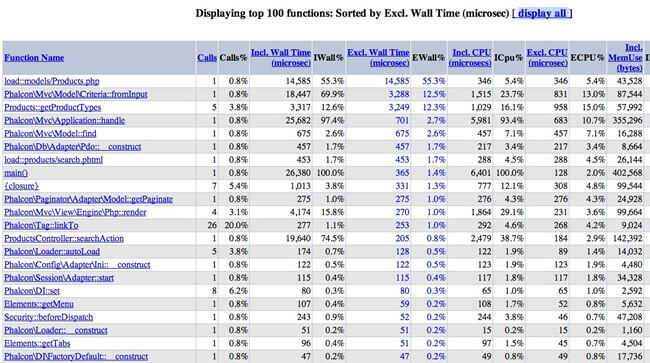
Using a tool such as Webgrind will allow you to connect to XDebug and get very valuable information as to what is going on with your code. Webgrind offers statistics on which methods are slower than others and other statistics.
Xhprof
Xhprof is another extension to profile PHP applications. To enable it, all you need is to add the following line to the start of the bootstrap file:
Then at the end of the file save the profiled data:
<?php

$xhprof_data = xhprof_disable('/tmp');

$XHPROF_ROOT = '/var/www/xhprof/';
include_once $XHPROF_ROOT . '/xhprof_lib/utils/xhprof_lib.php';
include_once $XHPROF_ROOT . '/xhprof_lib/utils/xhprof_runs.php';

$xhprof_runs = new XHProfRuns_Default();
$run_id = $xhprof_runs->save_run($xhprof_data, 'xhprof_testing');

echo "https://localhost/xhprof/xhprof_html/index.php?run={$run_id}&source=xhprof_testing\n";
Xhprof provides a built-in HTML viewer to analyze the profiled data:
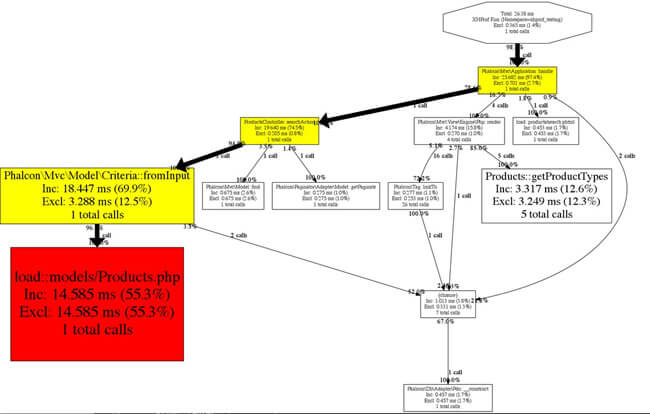
As mentioned above, profiling can increase the load on your server. In the case of Xhprof, you can introduce a conditional that would start profiling only after X requests.
SQL Statements
Almost all RDBMs offer tools to identify slow SQL statements. Identifying and fixing slow queries is very important in terms of performance on the server side. MariaDB / MySql / AuroraDb offer configuration settings that enable a slow-query log. The database then keeps its own metrics and whenever a query takes long to complete it will be logged in the slow-query log. The log can then be analyzed by the development team and adjustments can be made.
To enable this feature you will need to add this to my.cnf (don't forget to restart your database server)
Client
Another area to focus on is the client. Improving the loading of assets such as images, stylesheets, javascript files can significantly improve performance and enhance user experience. There are a number of tools that can help with identifying bottlenecks on the client:
Browsers
Most modern browsers have tools to profile a page's loading time. Those are easily called web inspectors or developer tools. For instance when using Brave or any Chromium based browser you can inspect the page and the developer tools will show a waterfall of what has loaded for the current page (files), how much time it took and the total loading time:
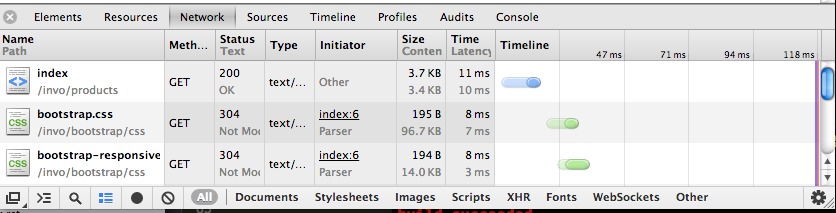
A relatively easy fix for increasing client performance is to set the correct headers for assets so that they expire in the future vs. being loaded from the server on every request. Additionally, CDN providers can help with distributing assets from their distribution centers that are closest to the client originating the request.
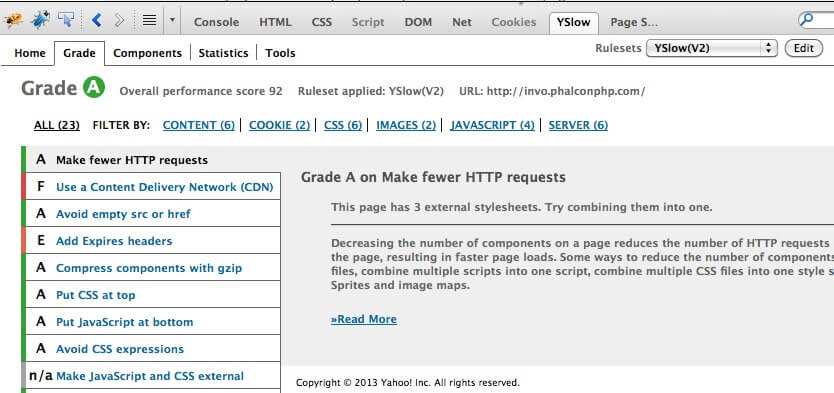
Yahoo! YSlow
YSlow analyzes web pages and suggests ways to improve their performance based on a set of rules for high performance web pages
PHP
PHP is becoming faster with every new version. Using the latest version improves the performance of your applications and also of Phalcon.
Bytecode Cache
OPcache as many other bytecode caches helps applications reduce the overhead of read, tokenize and parse PHP files in each request. The interpreted results are kept in RAM between requests as long as PHP runs as fcgi (fpm) or mod_php. OPcache is bundled with php starting 5.5.0. To check if it is activated, look for the following entry in php.ini:
Furthermore, the amount of memory available for opcode caching needs to be enough to hold all files of your applications. The default of 128MB is usually enough for even larger codebases.Serverside cache
APCu can be used to cache the results of computational expensive operations or otherwise slow data sources like webservices with high latency. What makes a result cacheable is another topic, as a rule of thumb: the operations needs to be executed often and yield identical results. Make sure to measure through profiling that the optimizations actually improved execution time.
As with the aforementioned opcache, make sure, the amount of RAM available suits your application. Alternatives to APCu would be Redis or Memcached - although they need extra processes running on your server or another machine.
Slow Tasks
Based on the requirements of your application, there maybe times that you will need to perform long running tasks. Examples of such tasks could be processing a video, optimizing images, sending emails, generating PDF documents etc. These tasks should be processed using background jobs. The usual process is: - The application initiates a task by sending a message to a queue service - The user sees a message that the task has been scheduled - In the background (or different server), worker scripts peek at the queue - When a message arrives, the worker script detects the type of message and calls the relevant task script - Once the task finishes, the user is notified that their data is ready.
The above is a simplistic view of how a queue service for background processing works, but can offer ideas on how background tasks can be executed. There are also a variety of queue services available that you can leverage using the relevant PHP libraries:
Page Speed
mod_pagespeed speeds up your site and reduces page load time. This open-source Apache HTTP server module (also available for nginx) automatically applies web performance best practices to pages, and associated assets (CSS, JavaScript, images) without requiring you to modify your existing content or workflow.